Drawing and Graphics
Note
When the terms “Drawings” or “Graphics” are mentioned here we are referring to “Vector Graphics” or “Line Art”.
Therefore please consider these terms as being synonymous!
PDF files support elementary drawing operations as part of their syntax. These are vector graphics and include basic geometrical objects like lines, curves, circles, rectangles including specifying colors.
The syntax for such operations is defined in “A Operator Summary” on page 643 of the Adobe PDF References. Specifying these operators for a PDF page happens in its contents objects.
PyMuPDF implements a large part of the available features via its Shape class, which is comparable to notions like “canvas” in other packages (e.g. reportlab).
A shape is always created as a child of a page, usually with an instruction like shape = page.new_shape(). The class defines numerous methods that perform drawing operations on the page’s area. For example, last_point = shape.draw_rect(rect) draws a rectangle along the borders of a suitably defined rect = pymupdf.Rect(...).
The returned last_point always is the Point where drawing operation ended (“last point”). Every such elementary drawing requires a subsequent Shape.finish() to “close” it, but there may be multiple drawings which have one common finish() method.
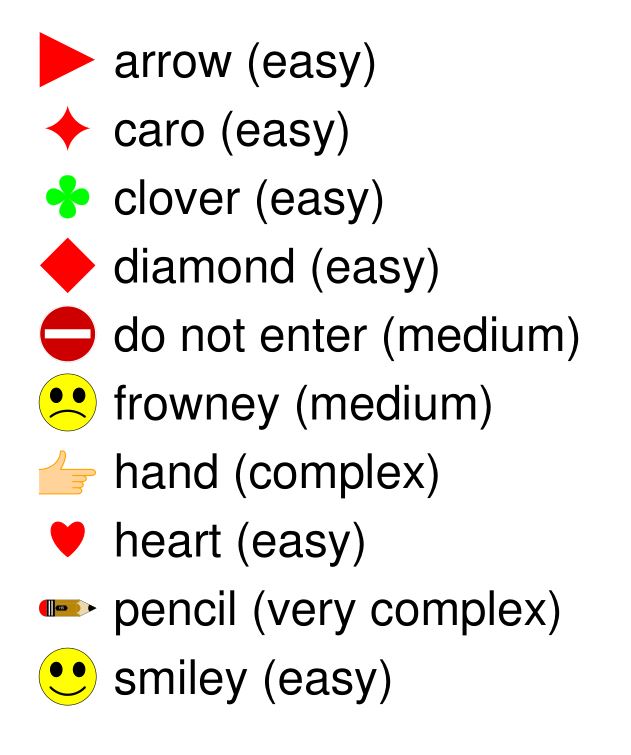
In fact, Shape.finish() defines a group of preceding draw operations to form one – potentially rather complex – graphics object. PyMuPDF provides several predefined graphics in shapes_and_symbols.py which demonstrate how this works.
If you import this script, you can also directly use its graphics as in the following example:
# -*- coding: utf-8 -*-
"""
Created on Sun Dec  9 08:34:06 2018

@author: Jorj
@license: GNU AFFERO GPL V3

Create a list of available symbols defined in shapes_and_symbols.py

This also demonstrates an example usage: how these symbols could be used
as bullet-point symbols in some text.

"""

import pymupdf
import shapes_and_symbols as sas

# list of available symbol functions and their descriptions
tlist = [
         (sas.arrow, "arrow (easy)"),
         (sas.caro, "caro (easy)"),
         (sas.clover, "clover (easy)"),
         (sas.diamond, "diamond (easy)"),
         (sas.dontenter, "do not enter (medium)"),
         (sas.frowney, "frowney (medium)"),
         (sas.hand, "hand (complex)"),
         (sas.heart, "heart (easy)"),
         (sas.pencil, "pencil (very complex)"),
         (sas.smiley, "smiley (easy)"),
         ]

r = pymupdf.Rect(50, 50, 100, 100)  # first rect to contain a symbol
d = pymupdf.Rect(0, r.height + 10, 0, r.height + 10)  # displacement to next rect
p = (15, -r.height * 0.2)  # starting point of explanation text
rlist = [r]  # rectangle list

for i in range(1, len(tlist)):  # fill in all the rectangles
    rlist.append(rlist[i-1] + d)

doc = pymupdf.open()  # create empty PDF
page = doc.new_page()  # create an empty page
shape = page.new_shape()  # start a Shape (canvas)

for i, r in enumerate(rlist):
    tlist[i][0](shape, rlist[i])  # execute symbol creation
    shape.insert_text(rlist[i].br + p,  # insert description text
                   tlist[i][1], fontsize=r.height/1.2)

# store everything to the page's /Contents object
shape.commit()

import os
scriptdir = os.path.dirname(__file__)
doc.save(os.path.join(scriptdir, "symbol-list.pdf"))  # save the PDF
This is the script’s outcome:
How to Extract Drawings
New in v1.18.0
Drawing commands (vector graphics) issued by a page can be extracted as a list of dictionaries. Interestingly, this is possible for all supported document types – not just PDF: so you can use it for XPS, EPUB and others as well.
Page method, Page.get_drawings() accesses draw commands and converts them into a list of Python dictionaries. Each dictionary – called a “path” – represents a separate drawing – it may be simple like a single line, or a complex combination of lines and curves representing one of the shapes of the previous section.
The path dictionary has been designed such that it can easily be used by the Shape class and its methods. Here is an example for a page with one path, that draws a red-bordered yellow circle inside rectangle Rect(100, 100, 200, 200):
>>> pprint(page.get_drawings())
[{'closePath': True,
'color': [1.0, 0.0, 0.0],
'dashes': '[] 0',
'even_odd': False,
'fill': [1.0, 1.0, 0.0],
'items': [('c',
            Point(100.0, 150.0),
            Point(100.0, 177.614013671875),
            Point(122.38600158691406, 200.0),
            Point(150.0, 200.0)),
            ('c',
            Point(150.0, 200.0),
            Point(177.61399841308594, 200.0),
            Point(200.0, 177.614013671875),
            Point(200.0, 150.0)),
            ('c',
            Point(200.0, 150.0),
            Point(200.0, 122.385986328125),
            Point(177.61399841308594, 100.0),
            Point(150.0, 100.0)),
            ('c',
            Point(150.0, 100.0),
            Point(122.38600158691406, 100.0),
            Point(100.0, 122.385986328125),
            Point(100.0, 150.0))],
'lineCap': (0, 0, 0),
'lineJoin': 0,
'opacity': 1.0,
'rect': Rect(100.0, 100.0, 200.0, 200.0),
'width': 1.0}]
>>>
Note
You need (at least) 4 Bézier curves (of 3rd order) to draw a circle with acceptable precision. See this Wikipedia article for some background.
The following is a code snippet which extracts the drawings of a page and re-draws them on a new page:
import pymupdf
doc = pymupdf.open("some.file")
page = doc[0]
paths = page.get_drawings()  # extract existing drawings
# this is a list of "paths", which can directly be drawn again using Shape
# -------------------------------------------------------------------------
#
# define some output page with the same dimensions
outpdf = pymupdf.open()
outpage = outpdf.new_page(width=page.rect.width, height=page.rect.height)
shape = outpage.new_shape()  # make a drawing canvas for the output page
# --------------------------------------
# loop through the paths and draw them
# --------------------------------------
for path in paths:
    # ------------------------------------
    # draw each entry of the 'items' list
    # ------------------------------------
    for item in path["items"]:  # these are the draw commands
        if item[0] == "l":  # line
            shape.draw_line(item[1], item[2])
        elif item[0] == "re":  # rectangle
            shape.draw_rect(item[1])
        elif item[0] == "qu":  # quad
            shape.draw_quad(item[1])
        elif item[0] == "c":  # curve
            shape.draw_bezier(item[1], item[2], item[3], item[4])
        else:
            raise ValueError("unhandled drawing", item)
    # ------------------------------------------------------
    # all items are drawn, now apply the common properties
    # to finish the path
    # ------------------------------------------------------
    shape.finish(
        fill=path["fill"],  # fill color
        color=path["color"],  # line color
        dashes=path["dashes"],  # line dashing
        even_odd=path.get("even_odd", True),  # control color of overlaps
        closePath=path["closePath"],  # whether to connect last and first point
        lineJoin=path["lineJoin"],  # how line joins should look like
        lineCap=max(path["lineCap"]),  # how line ends should look like
        width=path["width"],  # line width
        stroke_opacity=path.get("stroke_opacity", 1),  # same value for both
        fill_opacity=path.get("fill_opacity", 1),  # opacity parameters
        )
# all paths processed - commit the shape to its page
shape.commit()
outpdf.save("drawings-page-0.pdf")
As can be seen, there is a high congruence level with the Shape class. With one exception: For technical reasons lineCap is a tuple of 3 numbers here, whereas it is an integer in Shape (and in PDF). So we simply take the maximum value of that tuple.
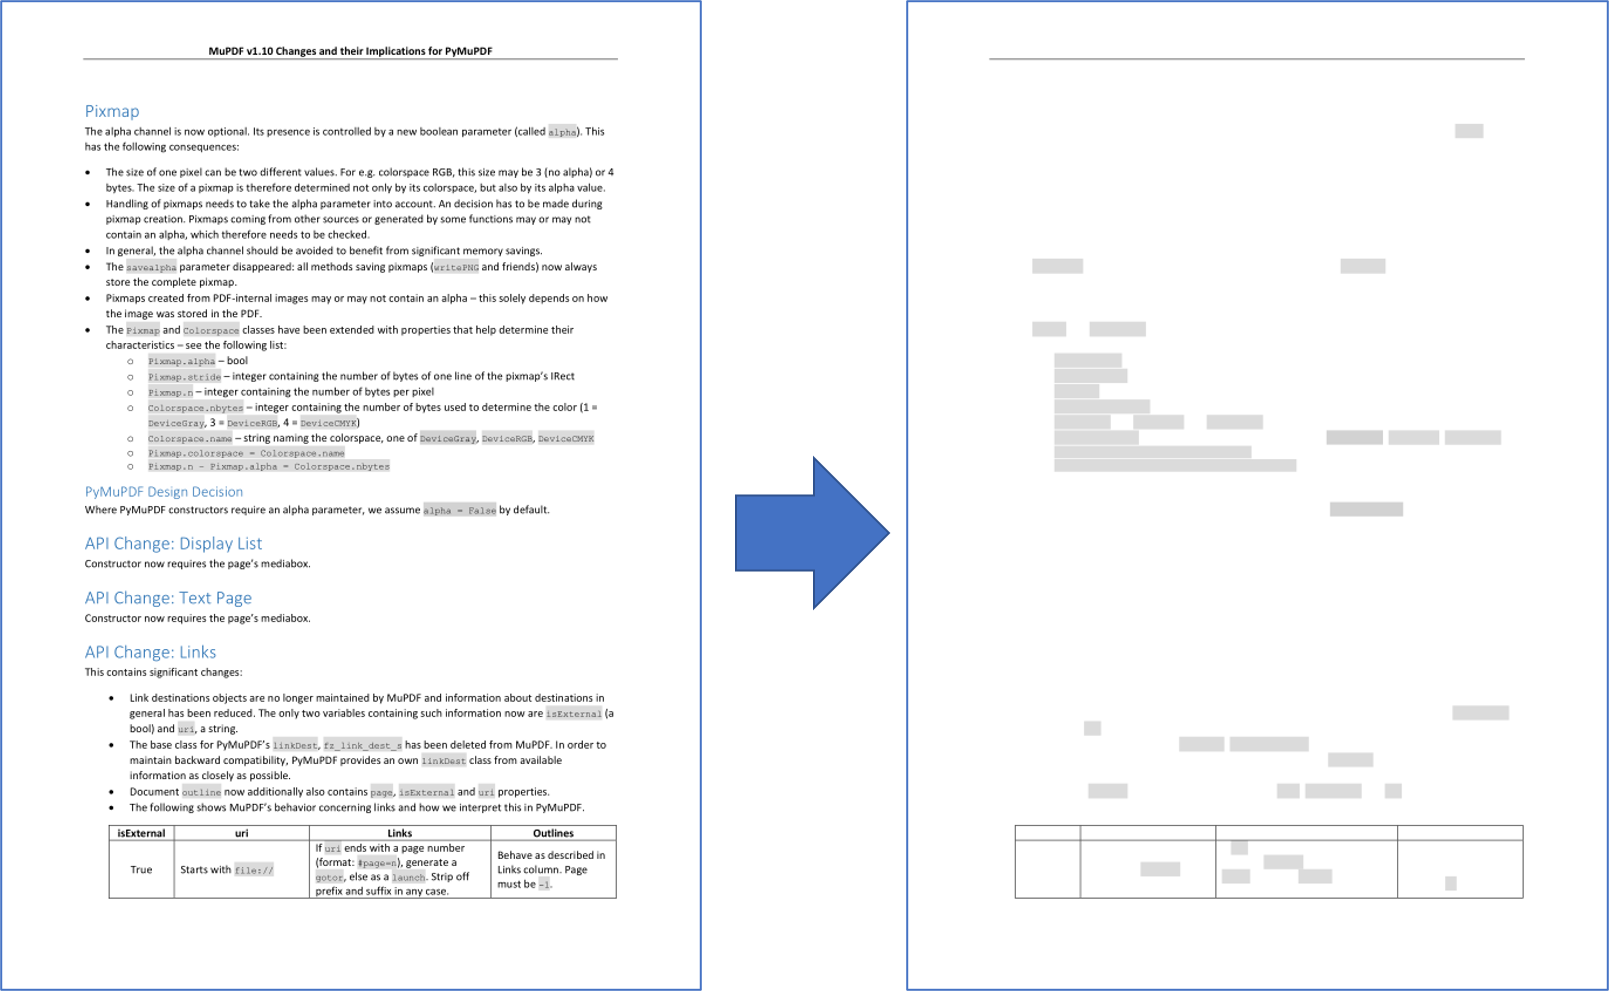
Here is a comparison between input and output of an example page, created by the previous script:
Note
The reconstruction of graphics, like shown here, is not perfect. The following aspects will not be reproduced as of this version:
Page definitions can be complex and include instructions for not showing / hiding certain areas to keep them invisible. Things like this are ignored by
Page.get_drawings()- it will always return all paths.
Note
You can use the path list to make your own lists of e.g. all lines or all rectangles on the page and subselect them by criteria, like color or position on the page etc.
How to Delete Drawings
To delete drawings/vector graphics we must use a Redaction Annotation with the bounding box of the drawing and then add and apply a redaction to it to delete it.
The following code shows an example of deleting the first drawing found on the page:
paths = page.get_drawings()
rect = paths[0]["rect"]  # rectangle of the 1st drawing
page.add_redact_annot(rect)
page.apply_redactions(0,2,1)  # potentially set options for any of images, drawings, text
Note
See Page.apply_redactions() for the parameter options which can be sent - you are able to apply deletion options to image, drawing and text objects which are bound by the annotation area.
How to Draw Graphics
Drawing graphics is as simple as calling the type of Drawing Method you may want. You can draw graphics directly on pages or within shape objects.
For example, to draw a circle:
# Draw a circle on the page using the Page method
page.draw_circle((center_x, center_y), radius, color=(1, 0, 0), width=2)

# Draw a circle on the page using a Shape object
shape = page.new_shape()
shape.draw_circle((center_x, center_y), radius)
shape.finish(color=(1, 0, 0), width=2)
shape.commit(overlay=True)
The Shape object can be used to combine multiple drawings that should receive common properties as specified by Shape.finish().