그리기 및 그래픽
참고
여기서 “Drawings” 또는 “Graphics”라는 용어가 언급될 때는 “벡터 그래픽” 또는 “선화”를 의미합니다.
따라서 이러한 용어를 동의어로 간주하세요!
PDF 파일은 구문의 일부로 기본 그리기 작업을 지원합니다. 이것들은 벡터 그래픽 이며 선, 곡선, 원, 사각형과 같은 기본 기하학적 객체를 포함하며 색상 지정도 포함합니다.
이러한 작업의 구문은 Adobe PDF 참조 의 643페이지의 “A Operator Summary”에 정의되어 있습니다. PDF 페이지에 대한 이러한 연산자 지정은 해당 contents 객체에서 수행됩니다.
PyMuPDF 는 Shape 클래스를 통해 사용 가능한 기능의 대부분을 구현하며, 이는 다른 패키지(예: reportlab)의 “canvas”와 같은 개념과 유사합니다.
Shape는 항상 페이지의 자식 으로 생성되며, 일반적으로 shape = page.new_shape() 와 같은 명령으로 생성됩니다. 이 클래스는 페이지 영역에서 그리기 작업을 수행하는 여러 메서드를 정의합니다. 예를 들어, last_point = shape.draw_rect(rect) 는 적절히 정의된 rect = pymupdf.Rect(...) 의 경계를 따라 사각형을 그립니다.
반환된 last_point 는 항상 그리기 작업이 끝난 Point (“마지막 점”)입니다. 이러한 모든 기본 그리기는 “닫기”를 위해 후속 Shape.finish() 가 필요하지만, 하나의 공통 finish() 메서드를 가진 여러 그리기가 있을 수 있습니다.
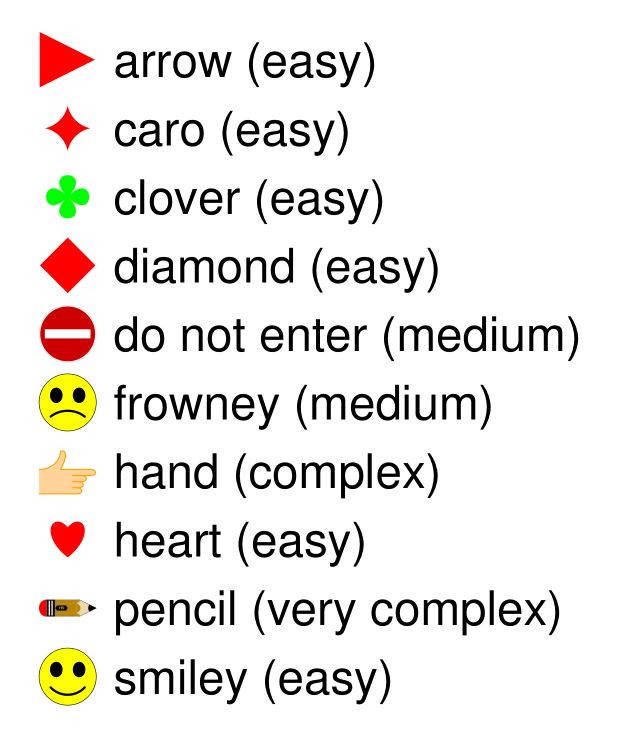
실제로 Shape.finish() 는 앞선 그리기 작업 그룹을 하나의 잠재적으로 복잡한 그래픽 객체로 형성하도록 정의 합니다. PyMuPDF 는 이것이 어떻게 작동하는지 보여주는 shapes_and_symbols.py 에 여러 사전 정의된 그래픽을 제공합니다.
이 스크립트를 가져오면 다음 예제와 같이 그래픽을 직접 사용할 수도 있습니다:
# -*- coding: utf-8 -*-
"""
Created on Sun Dec  9 08:34:06 2018

@author: Jorj
@license: GNU AFFERO GPL V3

Create a list of available symbols defined in shapes_and_symbols.py

This also demonstrates an example usage: how these symbols could be used
as bullet-point symbols in some text.

"""

import pymupdf
import shapes_and_symbols as sas

# list of available symbol functions and their descriptions
tlist = [
         (sas.arrow, "arrow (easy)"),
         (sas.caro, "caro (easy)"),
         (sas.clover, "clover (easy)"),
         (sas.diamond, "diamond (easy)"),
         (sas.dontenter, "do not enter (medium)"),
         (sas.frowney, "frowney (medium)"),
         (sas.hand, "hand (complex)"),
         (sas.heart, "heart (easy)"),
         (sas.pencil, "pencil (very complex)"),
         (sas.smiley, "smiley (easy)"),
         ]

r = pymupdf.Rect(50, 50, 100, 100)  # first rect to contain a symbol
d = pymupdf.Rect(0, r.height + 10, 0, r.height + 10)  # displacement to next rect
p = (15, -r.height * 0.2)  # starting point of explanation text
rlist = [r]  # rectangle list

for i in range(1, len(tlist)):  # fill in all the rectangles
    rlist.append(rlist[i-1] + d)

doc = pymupdf.open()  # create empty PDF
page = doc.new_page()  # create an empty page
shape = page.new_shape()  # start a Shape (canvas)

for i, r in enumerate(rlist):
    tlist[i][0](shape, rlist[i])  # execute symbol creation
    shape.insert_text(rlist[i].br + p,  # insert description text
                   tlist[i][1], fontsize=r.height/1.2)

# store everything to the page's /Contents object
shape.commit()

import os
scriptdir = os.path.dirname(__file__)
doc.save(os.path.join(scriptdir, "symbol-list.pdf"))  # save the PDF
이것은 스크립트의 결과입니다:
그리기 추출 방법
v1.18.0의 새로운 기능
페이지에서 발행한 그리기 명령(벡터 그래픽)은 딕셔너리 목록으로 추출할 수 있습니다. 흥미롭게도 이것은 모든 지원 문서 유형 에 대해 가능합니다. PDF뿐만 아니라 XPS, EPUB 등에도 사용할 수 있습니다.
페이지 메서드 Page.get_drawings() 는 그리기 명령에 액세스하여 Python 딕셔너리 목록으로 변환합니다. 각 딕셔너리( “path” 라고 함)는 별도의 그리기를 나타냅니다. 단일 선과 같이 간단할 수도 있고, 이전 섹션의 모양 중 하나를 나타내는 선과 곡선의 복잡한 조합일 수도 있습니다.
path 딕셔너리는 Shape 클래스와 그 메서드에서 쉽게 사용할 수 있도록 설계되었습니다. 다음은 하나의 경로를 가진 페이지의 예로, Rect(100, 100, 200, 200) 내부에 빨간색 테두리의 노란색 원을 그립니다:
>>> pprint(page.get_drawings())
[{'closePath': True,
'color': [1.0, 0.0, 0.0],
'dashes': '[] 0',
'even_odd': False,
'fill': [1.0, 1.0, 0.0],
'items': [('c',
            Point(100.0, 150.0),
            Point(100.0, 177.614013671875),
            Point(122.38600158691406, 200.0),
            Point(150.0, 200.0)),
            ('c',
            Point(150.0, 200.0),
            Point(177.61399841308594, 200.0),
            Point(200.0, 177.614013671875),
            Point(200.0, 150.0)),
            ('c',
            Point(200.0, 150.0),
            Point(200.0, 122.385986328125),
            Point(177.61399841308594, 100.0),
            Point(150.0, 100.0)),
            ('c',
            Point(150.0, 100.0),
            Point(122.38600158691406, 100.0),
            Point(100.0, 122.385986328125),
            Point(100.0, 150.0))],
'lineCap': (0, 0, 0),
'lineJoin': 0,
'opacity': 1.0,
'rect': Rect(100.0, 100.0, 200.0, 200.0),
'width': 1.0}]
>>>
참고
허용 가능한 정밀도로 원을 그리려면 (최소한) 4개의 3차 베지어 곡선이 필요합니다. 배경 정보는 이 Wikipedia article 를 참조하세요.
다음은 페이지의 그리기를 추출하여 새 페이지에 다시 그리는 코드 스니펫입니다:
import pymupdf
doc = pymupdf.open("some.file")
page = doc[0]
paths = page.get_drawings()  # extract existing drawings
# this is a list of "paths", which can directly be drawn again using Shape
# -------------------------------------------------------------------------
#
# define some output page with the same dimensions
outpdf = pymupdf.open()
outpage = outpdf.new_page(width=page.rect.width, height=page.rect.height)
shape = outpage.new_shape()  # make a drawing canvas for the output page
# --------------------------------------
# loop through the paths and draw them
# --------------------------------------
for path in paths:
    # ------------------------------------
    # draw each entry of the 'items' list
    # ------------------------------------
    for item in path["items"]:  # these are the draw commands
        if item[0] == "l":  # line
            shape.draw_line(item[1], item[2])
        elif item[0] == "re":  # rectangle
            shape.draw_rect(item[1])
        elif item[0] == "qu":  # quad
            shape.draw_quad(item[1])
        elif item[0] == "c":  # curve
            shape.draw_bezier(item[1], item[2], item[3], item[4])
        else:
            raise ValueError("unhandled drawing", item)
    # ------------------------------------------------------
    # all items are drawn, now apply the common properties
    # to finish the path
    # ------------------------------------------------------
    shape.finish(
        fill=path["fill"],  # fill color
        color=path["color"],  # line color
        dashes=path["dashes"],  # line dashing
        even_odd=path.get("even_odd", True),  # control color of overlaps
        closePath=path["closePath"],  # whether to connect last and first point
        lineJoin=path["lineJoin"],  # how line joins should look like
        lineCap=max(path["lineCap"]),  # how line ends should look like
        width=path["width"],  # line width
        stroke_opacity=path.get("stroke_opacity", 1),  # same value for both
        fill_opacity=path.get("fill_opacity", 1),  # opacity parameters
        )
# all paths processed - commit the shape to its page
shape.commit()
outpdf.save("drawings-page-0.pdf")
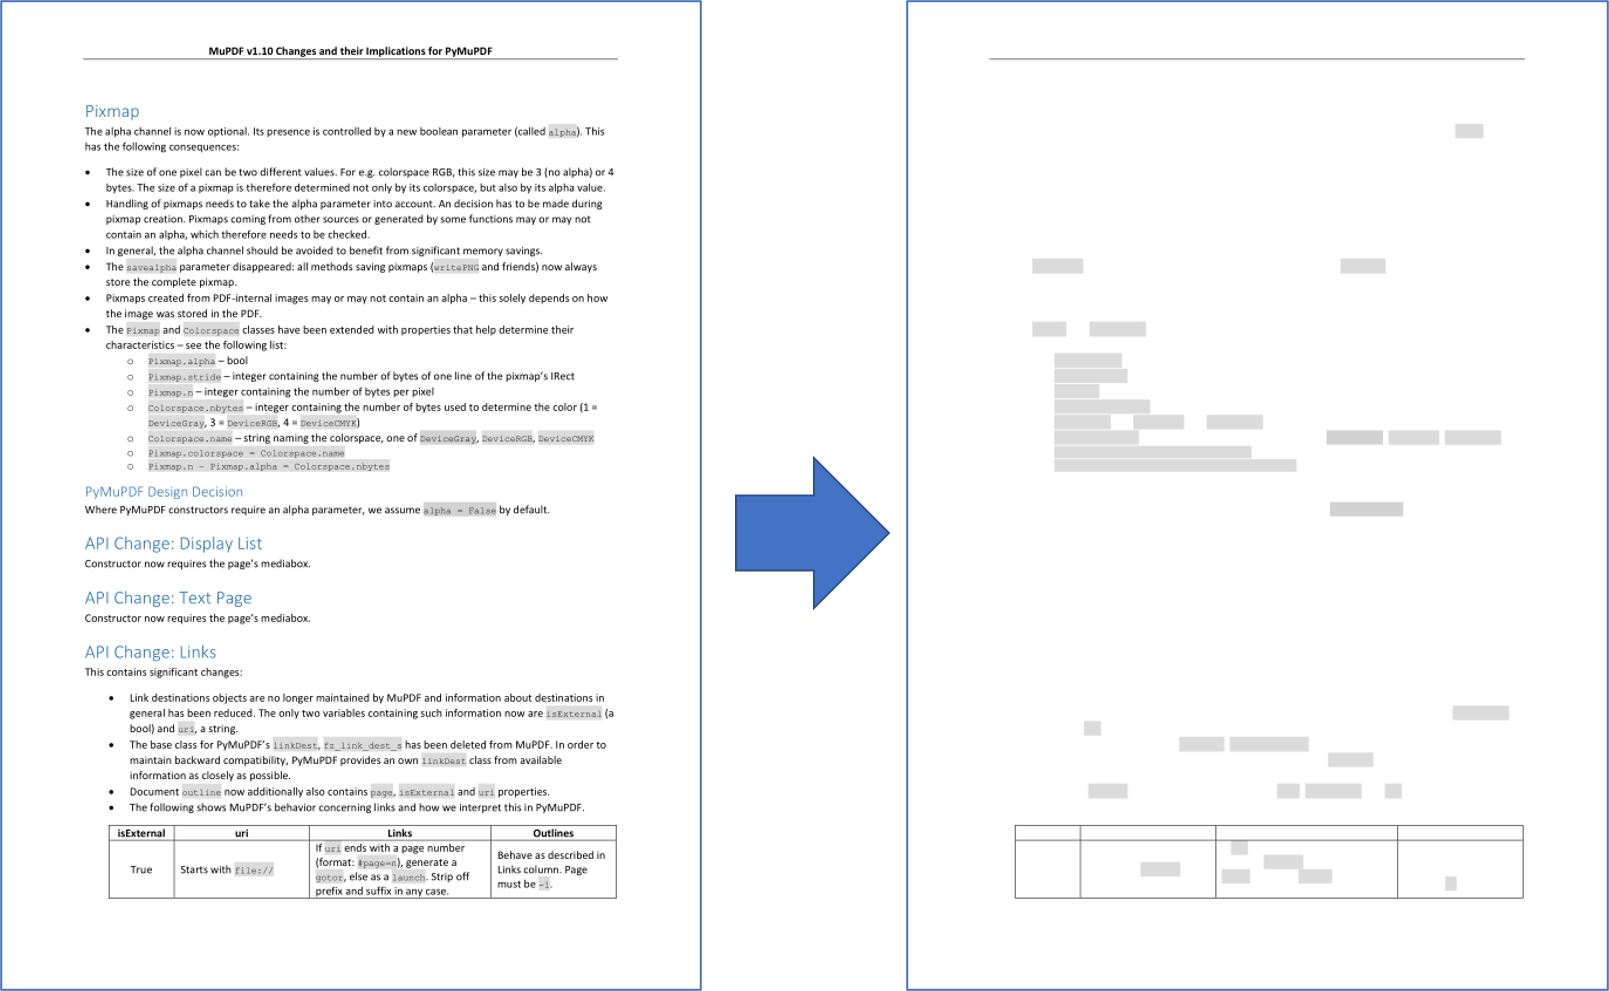
보시다시피, Shape 클래스와 높은 일치 수준이 있습니다. 한 가지 예외가 있습니다. 기술적 이유로 여기서는 lineCap 이 3개의 숫자 튜플이지만, Shape (및 PDF)에서는 정수입니다. 따라서 해당 튜플의 최대값을 사용합니다.
다음은 이전 스크립트로 생성된 예제 페이지의 입력과 출력 비교입니다:
참고
여기에 표시된 것과 같은 그래픽 재구성은 완벽하지 않습니다. 다음 측면은 이 버전에서 재현되지 않습니다:
페이지 정의는 복잡할 수 있으며 특정 영역을 보이지 않게 유지하기 위해 표시하지 않거나 숨기는 지시를 포함할 수 있습니다. 이러한 사항은
Page.get_drawings()에 의해 무시됩니다. 항상 모든 경로를 반환합니다.
참고
경로 목록을 사용하여 예를 들어 페이지의 모든 선 또는 모든 사각형 목록을 만들고 색상이나 페이지의 위치 등의 기준으로 하위 선택할 수 있습니다.
그리기 삭제 방법
그리기/벡터 그래픽을 삭제하려면 그리기의 경계 상자를 사용하여 Redaction Annotation 을 사용한 다음 추가하고 적용 하여 삭제해야 합니다.
다음 코드는 페이지에서 찾은 첫 번째 그리기를 삭제하는 예제를 보여줍니다:
paths = page.get_drawings()
rect = paths[0]["rect"]  # rectangle of the 1st drawing
page.add_redact_annot(rect)
page.apply_redactions(0,2,1)  # potentially set options for any of images, drawings, text
참고
전송할 수 있는 매개변수 옵션은 Page.apply_redactions() 를 참조하세요. 주석 영역에 의해 경계가 지정된 이미지, 그리기 및 텍스트 객체에 삭제 옵션을 적용할 수 있습니다.
그래픽 그리기 방법
그래픽을 그리는 것은 원하는 Drawing Method 유형을 호출하는 것만큼 간단합니다. 페이지에 직접 또는 shape 객체 내에서 그래픽을 그릴 수 있습니다.
예를 들어, 원을 그리려면:
# Draw a circle on the page using the Page method
page.draw_circle((center_x, center_y), radius, color=(1, 0, 0), width=2)

# Draw a circle on the page using a Shape object
shape = page.new_shape()
shape.draw_circle((center_x, center_y), radius)
shape.finish(color=(1, 0, 0), width=2)
shape.commit(overlay=True)
Shape 객체는 Shape.finish() 에서 지정한 공통 속성을 받아야 하는 여러 그리기를 결합하는 데 사용할 수 있습니다.